CMG’25 Hackathon guidelines
ANNONCE (to publish before conference)
The task is to find some change points and/or anomalies in the given time stamped data to see different phases/patterns .
Participants can use any tools or libraries/packages (in R, Python and so on) to detect change points and/or anomalies in the data.
Or they can use the free Change Points detection API (e.g. via Postman.com) described in
Change Point Detection is implemented in the free web tool Perfomalist
Particularly the instruction on how to use that is described HERE.
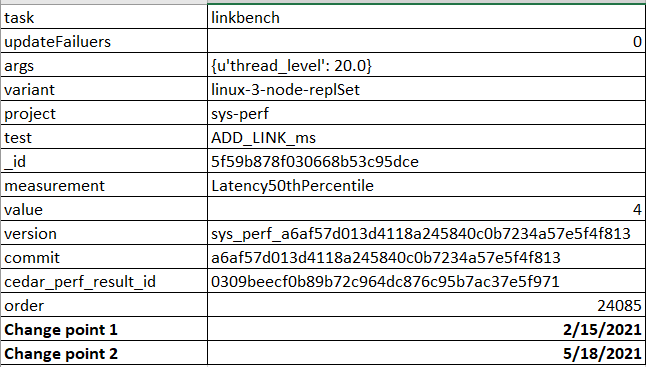
To visualize the result any spreadsheet charting could be used or other means (e.g. python, R and so on). Examples are on the following picture:


The time to work on the task - 3 hours.
The result would be judged by CMG experts and the winner will get an award and time to make a short presentation.
Vendors of similar tools are welcome to participate.
If participants would like to use MATLAB for anomaly detection tools, we have a licensed version available here:
URL for event page: https://www.mathworks.com/licensecenter/classroom/4866200/
1. this will take you to a MathWorks account Sign-in page.
2. Create an account or use an existing account
3. Press "Access MATLAB Online" button followed by "Open MATLAB Online"
On site activities
Data to test: https://github.com/numenta/NAB/tree/master/data
Particularly the following csv files:

LINK TO THE FOLDER WITH DATA IS HERE
EXAMPLE 1
Simple case: art_daily_flatmiddle.csv
Tool is performalist.com Change Point detection API described HERE
1st step to change the format of the data (using EXCEL or Google sheet means):
From original:
imestamp,value
2014-04-01 00:00:00,-21.0483826823
2014-04-01 00:05:00,-20.2954768676
2014-04-01 00:10:00,-18.127229468299998
2014-04-01 00:15:00,-20.1716653997
TO performalist form:
date,time,value
2014-04-01,0:00:00,-21.04838268
2014-04-01,0:05:00,-20.29547687
2014-04-01,0:10:00,-18.12722947
2014-04-01,0:15:00,-20.1716654
Then call perfomalist API (e.g. using postman.com)

The result is one change point on 2014-04-11, which can be easily validated by building the spreadsheet chart (see below):

EXAMPLE 2
More difficult case: https://github.com/numenta/NAB/blob/master/data/realTraffic/TravelTime_451.csv
After repeating the above steps (see Example 1) the result should show several change points:

sValue - Statistical band in %, where 100 is UCL=MAX, 0 is UCL=LCL=mean). (normality)
eValue - Exception Value (EV) threshold in % of actual historical average. (insensitivity)
BaseLineLength - The time period to compare current value against.
After adding there
sValue, 99
eValue, 20
BaseLineLength , 7
The API returns only 3 change points:

Putting the API output to EXCEL or Google sheet one can visualize the result by showing phases in the data between change points (see below):