Wednesday, December 22, 2021

Perfomalist

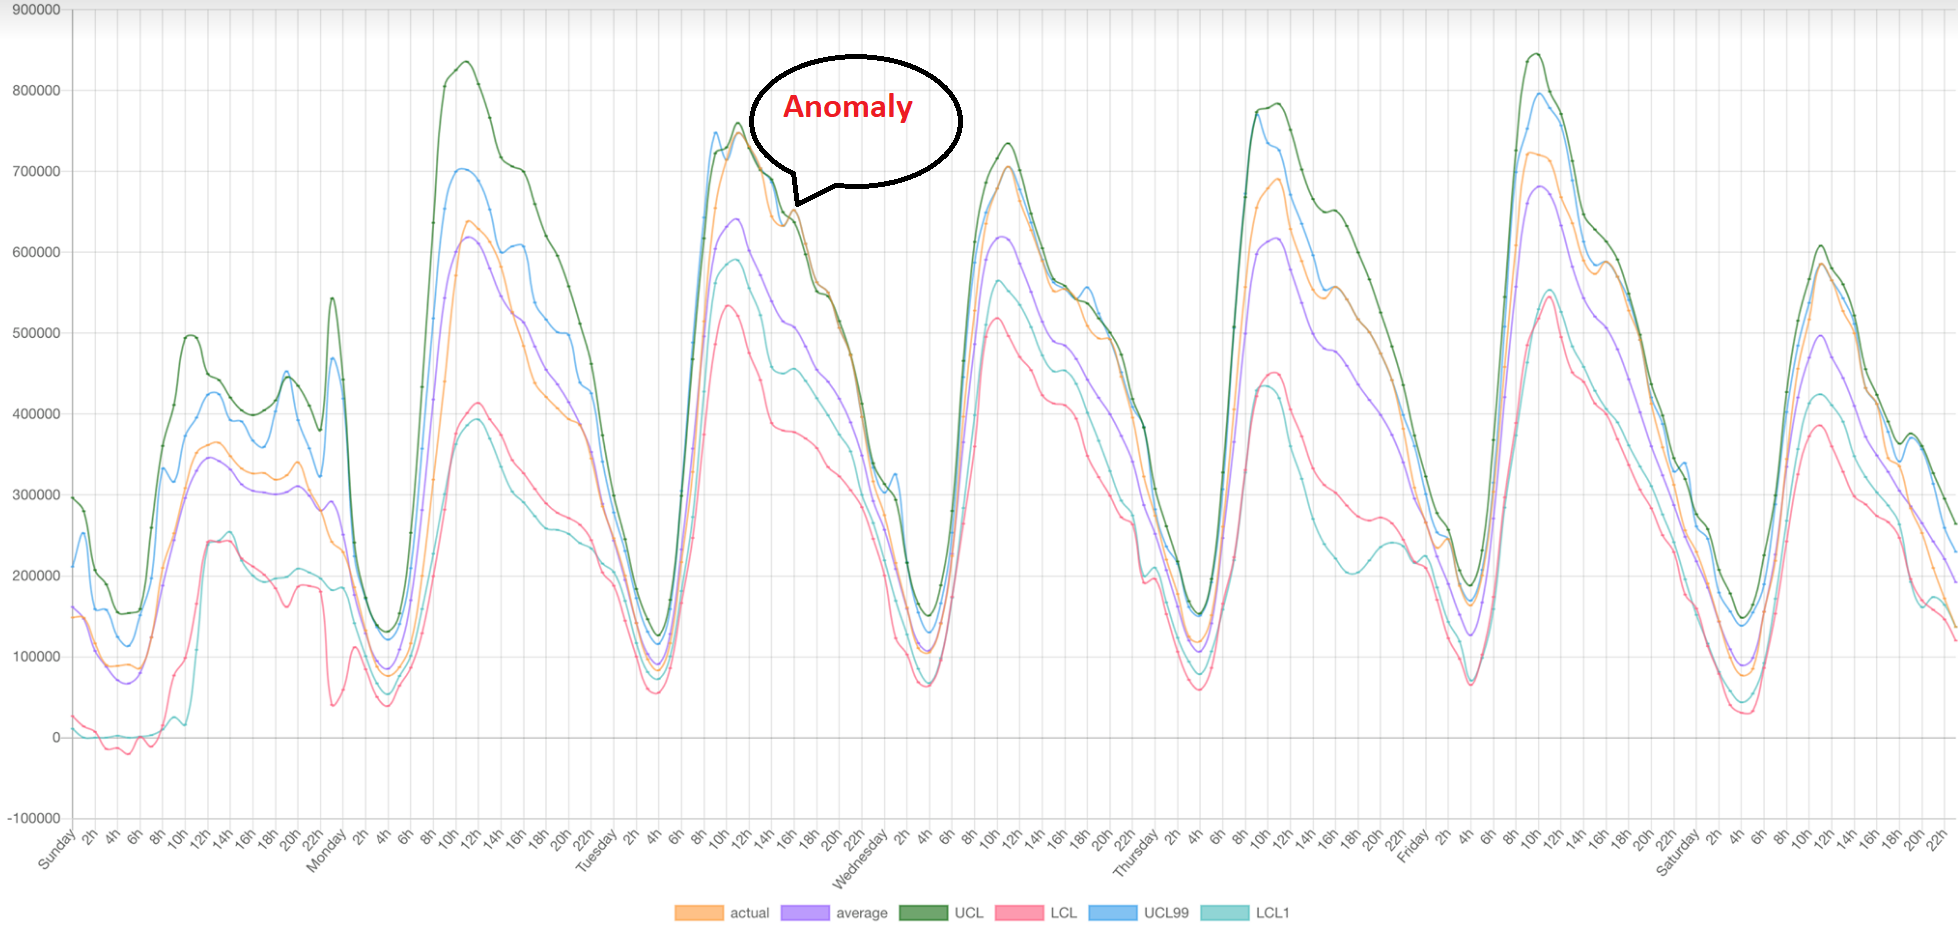
Perfomalist (www.Perfomalist.com) is a web based anomaly and change point detection tool. The method used by the tool is SETDS - Statistical Exception and Trend Detection System, which is a variation of the Statistical Process Control method applied to time series data. The key idea of the method is EV (Exception Value) which indicates the severity of anomalies calculated as a difference between control limits and actual anomalous data points. Any change that occurs first would appear as an anomaly and then may become a normality (new norm), so collecting overtime and analyzing the severity of all anomalies opens the possibility to find phases in the data history with different patterns. To detect change points between phases one just needs to find all the roots of the following equation:  EV(t)=0 , where t is time. [1]Using this method the Perfomalist API call returns all change points found in the input CSV data.

[1] - Igor Trubin, "Exception Based Modeling and Forecasting" , 34th International Computer Measurement Group Conference, December 7-12, 2008, Las Vegas, Nevada, USA, Proceedings


Sunday, November 21, 2021

The Change Points Detection Perfomalist API beta version is released. Everybody is welcome to test!

Link to tool: www.Perfomalist.com

Control Points API

POST https://api.perfomalist.com/api/controlpoints.py

'Accept: text/plain'
'Content-Type: text/csv'

Input

Post body should be input data in CSV format. First three lines are parameters also in CSV format.

  • sValue - Statistical band in %, where 100 is UCL=MAX, 0 is UCL=LCL=mean).
  • eValue - Exception Value (EV) threshold in % of actual historical average.
  • BaseLineLength - The time period to compare current value against.
For example:
sValue, 99
eValue, 5
BaseLineLength , 7

These may be omitted in which case default values will be used.

Parameters are followed by data as shown in example input which could downloaded from www.Perfomalist.com


Date, Hour, Value 

7/2/2011,0,236274 
7/2/2011,1,215359 
7/2/2011,2,170011
....

Input data should be provided as a body of the API call.

Output

Output is JSON style data:

{
    "Change Point": {            #full list of values for respective dates, populated by zeroes if no change point detected to aid with graphing
         "Date": value
    },
    "Change Points Only": {      #only dates of change points with respective values
        "Change Point": {
            "Date": value
        }
    },
    "Ev": {                      #exeption values for respective dates
        "Date": value
    },
    "LCL": {                     #lower control limit value for respective dates
        "Date": value
    },
    "Moving Average": {          #moving average value for respective dates
        "Date": value
    },
    "UCL": {                     #upper control limit value for respective dates
        "Date": value
    },
    "Value": {                   #user input value for respective dates
        "Date": value
    }
}
EXAMPLE 1 is applied against the sample data from www.Performalist.com by
using Postman tool:


After copying data to a spreadsheet, the control points could be validated visually:


EXAMLE 2: With a a some step jump event to detect:
Original Change Point Detection method explained here:
http://www.trub.in/2020/08/cpd-change-points-detection-is-planed.html

The next step is to build Perfomalist CPD UI.

Perfomalist team is presenting at www.CMGimpact.com international conference in Orlando.

PRODUCT:  www.Perfomalist.com www.CMGimpact.com LinkedIn Post ABSTRACT: The MASF/SETDS method of detecting changes and anomalies in performa...