
Welcome to PERFOMALIST v1.0 - date-time-stamped data on-line analyser https://www.perfomalist.com/
Functionality:
1. VISUALIZATION. Weekly (Monthly in v2+) data profiling to visualize patterns, anomalies and short term seasonality via IT-Control Charts. (v1.0)
2. ANALYSIS. Anomalies and Change Points Detection in date-time stamped data. (v2+)
INPUT: CSV file with timestamp data (time series observations of a dynamic object).
which should look like:
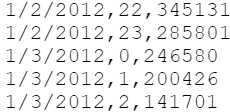
Data granularity: hourly (v1.0); minutely, daily (v2+)
OUTPUT:
- IT-Control Chart (see example below) (v1.0)
- Data cube with summarized data (168 rows/weekhours - v1.0)
- List of anomalies and change points (v2+)
Requirement:
Input data should consist of at least 3 weeks of history as the method requires comparing the last 7 days of data (actual) with at least 2 weeks long learning/reference data set (baseline).
The size of the history is limited by about 5 years. Unlimited size of input data will be implemented in v.2.
Additional resources:
- How to read IT-Control Chart (on-line article)


