
Saturday, April 3, 2021

Saturday, August 22, 2020
CPD - Change Points Detection is planed to be implemented in the free web tool Perfomalist. UPDATE: API is developed!
update : 11/21/21 The Perfomalist CPD API is released.
https://www.trutechdev.com/2021/11/the-change-points-detection-perfomalapi.html
_____________
See details: http://www.trub.in/2020/08/cpd-change-points-detection-is-planed.html

Monday, June 8, 2020
The "Exercise 5. Build your weekly IT-Control Chart by Perfomalist tool" was added to my on-line CMG class "Perfomaly Detection"
As more trainees keep enrolling to my CMG on-line class,
I have started updating the content.
So far I have added an additional exercise to use recently developed free performance profiler web tool "https://www.perfomalist.com/". So the trainees can build the weekly IT-Control Chart with the provided sample data and with their own data.
The exercise is open for every one here:
Tuesday, April 14, 2020

Monday, February 3, 2020
#AnomalyDetection Free Web App "PERFOMALIST" (v1.0) is online and ready for beta testing
Welcome to PERFOMALIST v1.0 - date-time-stamped data on-line analyser https://www.perfomalist.com/
Functionality:
1. VISUALIZATION. Weekly (Monthly in v2+) data profiling to visualize patterns, anomalies and short term seasonality via IT-Control Charts. (v1.0)
2. ANALYSIS. Anomalies and Change Points Detection in date-time stamped data. (v2+)
INPUT: CSV file with timestamp data (time series observations of a dynamic object).
which should look like:
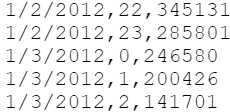
Data granularity: hourly (v1.0); minutely, daily (v2+)
OUTPUT:
- IT-Control Chart (see example below) (v1.0)
- Data cube with summarized data (168 rows/weekhours - v1.0)
- List of anomalies and change points (v2+)
Requirement:
Input data should consist of at least 3 weeks of history as the method requires comparing the last 7 days of data (actual) with at least 2 weeks long learning/reference data set (baseline).
The size of the history is limited by about 5 years. Unlimited size of input data will be implemented in v.2.
Additional resources:
- How to read IT-Control Chart (on-line article)

Thursday, April 19, 2018
My "Performance #AnomalyDetection" Online Course is Launched at CMG.org (#CMGnews)
- Link to the course is on CMG.org site
- $99 for CMG Members; $149 for Non-Members.
What is covered:
- Machine learning based Anomaly Detection technique
- Classical (SPC) and MASF (For system performance data) Control Chartirting
- Where is the Control Chart Used?
- What are the types of Control Charts?
- Reading, building, and interpreting Control Charts
- Typical cases of real world issues captured by anomaly detection system (VMs, Mainframes, Middleware, E2E response and more)
- How to build free AWS cloud server with R and build there control charts
- Performance anomaly (Perfomaly) detection system R implementation example (SEDS-lite - open source based tool)
See more:
Tuesday, December 26, 2017

Saturday, November 4, 2017
testing earn.com....
Earn.com for businesses
If you’re a sender and want to learn more about how you can use Earn.com to increase your response rates and get more actionable user and customer feedback, contact us: sales@earn.com
Monday, October 9, 2017
:format(webp)/cdn.vox-cdn.com/uploads/chorus_image/image/48673083/iphonecelebrationhearst.0.0.jpg)


Subscribe to:
Posts (Atom)
#ICPE2026 workshop presentation "Detecting past and future change points in performance data for education and practice"
Excited to share that we will be presenting at the ICPE 2026 Workshop (WEPPE) on May 4th in Florence, Italy. Our talk, "Detecting pas...

-
 Link to tool: www.Perfomalist.com Control Points API POST https://api.perfomalist.com/ api/controlpoints.py 'Accept: text/plain' ...
 -
CMG’25 Hackathon guidelines Below is one example from the document of using Performalist.com API: The result (hacks) could be sent to tr...
