

Monday, February 28, 2022

Monday, January 10, 2022
Perfomalist Release Notes
- Perfomalist 1.1. has now the Change Point Detection API as described in the previous post:
The Change Points Detection Perfomalist API beta version is released.
Contributors: Arvid Trubin,
Filipp Trubin
- Perfomalist 1.2. has additional two columns in the table view of the weekly profile to underline two types of anomalies the tool detects:
High Anomaly - Unusual high data value for particular hour calculated as Actual - UCL95 (only positive values of the subtraction is populated and represents EV+ which is Exception Value/significance of the anomaly)
Low Anomaly - Unusual low data value for particular hour calculated as UCL5 - Actual (only positive values of the subtraction is populated and represents EV- which is Exception Value /significance of the anomaly)
If the value of Low or/and High Anomaly is "0" the particular hour does not have any anomalies.
The number of anomalous week hours also counted and printed at the header of the columns in "()".
Contributor: Michael Berdichevsky

Thursday, January 6, 2022
Perfomalist is referenced in the following published at Springler paper:
LINK to paper: https://www.trub.in/2022/01/performance-anomaly-and-change-point.html

Intelligent Sustainable Systems pp 403-407| Cite as
Performance Anomaly and Change Point Detection for Large-Scale System Management
Wednesday, December 22, 2021
Perfomalist
Perfomalist (www.Perfomalist.com) is a web based anomaly and change point detection tool. The method used by the tool is SETDS - Statistical Exception and Trend Detection System, which is a variation of the Statistical Process Control method applied to time series data. The key idea of the method is EV (Exception Value) which indicates the severity of anomalies calculated as a difference between control limits and actual anomalous data points. Any change that occurs first would appear as an anomaly and then may become a normality (new norm), so collecting overtime and analyzing the severity of all anomalies opens the possibility to find phases in the data history with different patterns. To detect change points between phases one just needs to find all the roots of the following equation: EV(t)=0 , where t is time. [1]. Using this method the Perfomalist API call returns all change points found in the input CSV data.
[1] - Igor Trubin, "Exception Based Modeling and Forecasting" , 34th International Computer Measurement Group Conference, December 7-12, 2008, Las Vegas, Nevada, USA, Proceedings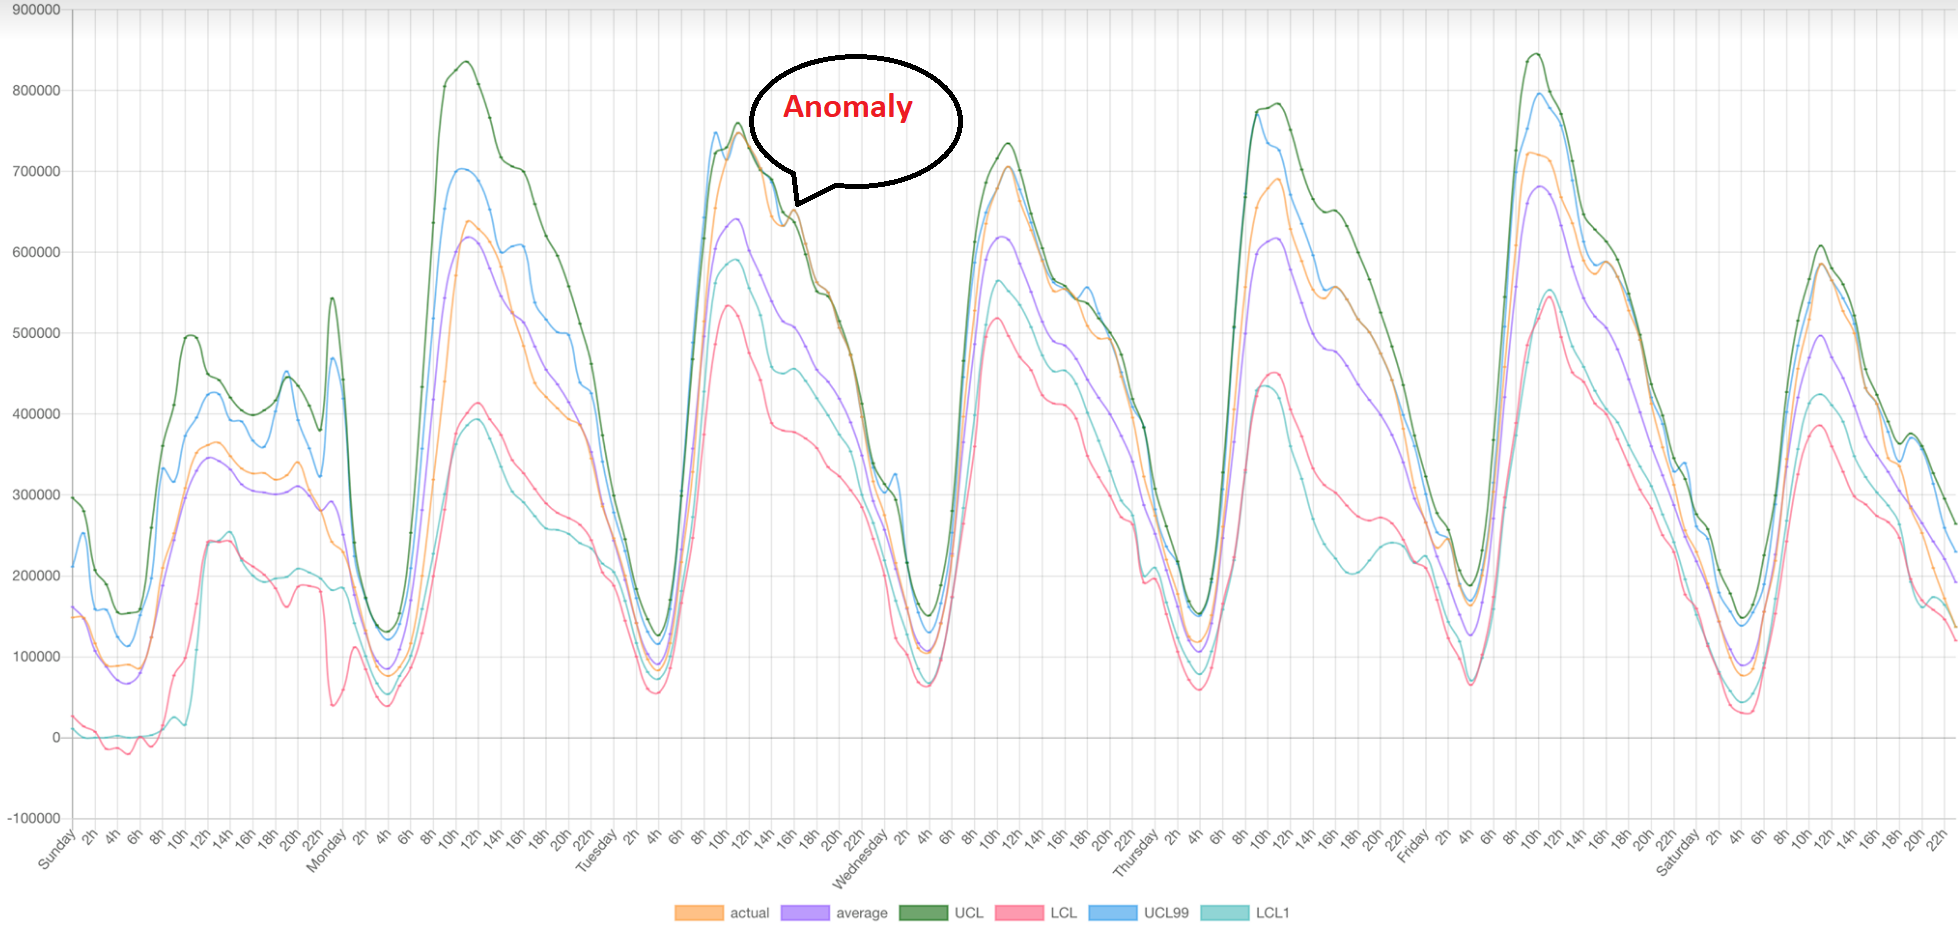

Thursday, December 2, 2021

Sunday, November 21, 2021
The Change Points Detection Perfomalist API beta version is released. Everybody is welcome to test!
Link to tool: www.Perfomalist.com
Control Points API
POST https://api.perfomalist.com/
'Accept: text/plain'
'Content-Type: text/csv'
Input
Post body should be input data in CSV format. First three lines are parameters also in CSV format.
- sValue - Statistical band in %, where 100 is UCL=MAX, 0 is UCL=LCL=mean).
- eValue - Exception Value (EV) threshold in % of actual historical average.
- BaseLineLength - The time period to compare current value against.
For example:sValue, 99
eValue, 5
BaseLineLength , 7
These may be omitted in which case default values will be used.
Parameters are followed by data as shown in example input which could downloaded from www.Perfomalist.com.
Date, Hour, Value
7/2/2011,0,236274
7/2/2011,1,215359
7/2/2011,2,170011
....
Input data should be provided as a body of the API call.
Output
Output is JSON style data:
{
    "Change Point": {            #full list of values for respective dates, populated by zeroes if no change point detected to aid with graphing
         "Date": value
    },
    "Change Points Only": {      #only dates of change points with respective values
        "Change Point": {
            "Date": value
        }
    },
    "Ev": {                      #exeption values for respective dates
        "Date": value
    },
    "LCL": {                     #lower control limit value for respective dates
        "Date": value
    },
    "Moving Average": {          #moving average value for respective dates
        "Date": value
    },
    "UCL": {                     #upper control limit value for respective dates
        "Date": value
    },
    "Value": {                   #user input value for respective dates
        "Date": value
    }
}using Postman tool:

Original Change Point Detection method explained here:After copying data to a spreadsheet, the control points could be validated visually:


http://www.trub.in/2020/08/cpd-change-points-detection-is-planed.html
The next step is to build Perfomalist CPD UI.
Saturday, April 3, 2021
Saturday, August 22, 2020
CPD - Change Points Detection is planed to be implemented in the free web tool Perfomalist. UPDATE: API is developed!
update : 11/21/21 The Perfomalist CPD API is released.
https://www.trutechdev.com/2021/11/the-change-points-detection-perfomalapi.html
_____________
See details: http://www.trub.in/2020/08/cpd-change-points-detection-is-planed.html

Monday, June 8, 2020
The "Exercise 5. Build your weekly IT-Control Chart by Perfomalist tool" was added to my on-line CMG class "Perfomaly Detection"
As more trainees keep enrolling to my CMG on-line class,
I have started updating the content.
So far I have added an additional exercise to use recently developed free performance profiler web tool "https://www.perfomalist.com/". So the trainees can build the weekly IT-Control Chart with the provided sample data and with their own data.
The exercise is open for every one here:
Tuesday, April 14, 2020

Monday, February 3, 2020
#AnomalyDetection Free Web App "PERFOMALIST" (v1.0) is online and ready for beta testing
Welcome to PERFOMALIST v1.0 - date-time-stamped data on-line analyser https://www.perfomalist.com/
Functionality:
1. VISUALIZATION. Weekly (Monthly in v2+) data profiling to visualize patterns, anomalies and short term seasonality via IT-Control Charts. (v1.0)
2. ANALYSIS. Anomalies and Change Points Detection in date-time stamped data. (v2+)
INPUT: CSV file with timestamp data (time series observations of a dynamic object).
which should look like:
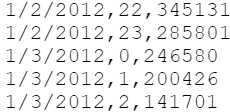
Data granularity: hourly (v1.0); minutely, daily (v2+)
OUTPUT:
- IT-Control Chart (see example below) (v1.0)
- Data cube with summarized data (168 rows/weekhours - v1.0)
- List of anomalies and change points (v2+)
Requirement:
Input data should consist of at least 3 weeks of history as the method requires comparing the last 7 days of data (actual) with at least 2 weeks long learning/reference data set (baseline).
The size of the history is limited by about 5 years. Unlimited size of input data will be implemented in v.2.
Additional resources:
- How to read IT-Control Chart (on-line article)

Subscribe to:
Posts (Atom)
#ICPE2026 workshop presentation "Detecting past and future change points in performance data for education and practice"
Excited to share that we will be presenting at the ICPE 2026 Workshop (WEPPE) on May 4th in Florence, Italy. Our talk, "Detecting pas...

-
 Link to tool: www.Perfomalist.com Control Points API POST https://api.perfomalist.com/ api/controlpoints.py 'Accept: text/plain' ...
 -
CMG’25 Hackathon guidelines Below is one example from the document of using Performalist.com API: The result (hacks) could be sent to tr...
